GaugeMon
Mac Performance Guide
Check GPU usage on a Mac
Short answer
In the app: open Activity Monitor and choose Window › GPU History. In the terminal, without sudo, read the GPU's own utilisation statistic with ioreg. For GPU frequency and power, use sudo powermetrics.
From the terminal
Utilisation, no sudo
ioreg -rc IOAccelerator | grep -o '"Device Utilization %"=[0-9]*'"Device Utilization %"=18It is an instantaneous value, so watch it for a while:
while true; do ioreg -rc IOAccelerator | grep -o '"Device Utilization %"=[0-9]*'; sleep 1; doneThe full PerformanceStatistics dictionary (ioreg -rc IOAccelerator -d 1) also has Renderer Utilization %, Tiler Utilization % and GPU memory in use.
Which GPU you have
system_profiler SPDisplaysDataType | head -12 Chipset Model: Apple M4 Max
Type: GPU
Total Number of Cores: 40Frequency and power, needs sudo
sudo powermetrics --samplers gpu_power -n 1powermetrics -h describes this sampler as "gpu power and frequency info". Add --show-process-gpu with the tasks sampler for per-process GPU time.
Reading the numbers
On Apple Silicon the GPU shares memory with the CPU, so "GPU memory" is part of your normal RAM. Short spikes are normal whenever windows animate; WindowServer itself uses the GPU to composite the screen. Sustained high utilisation with nothing obvious open usually points to a browser tab, a game or a background render.
The easier way: GaugeMon
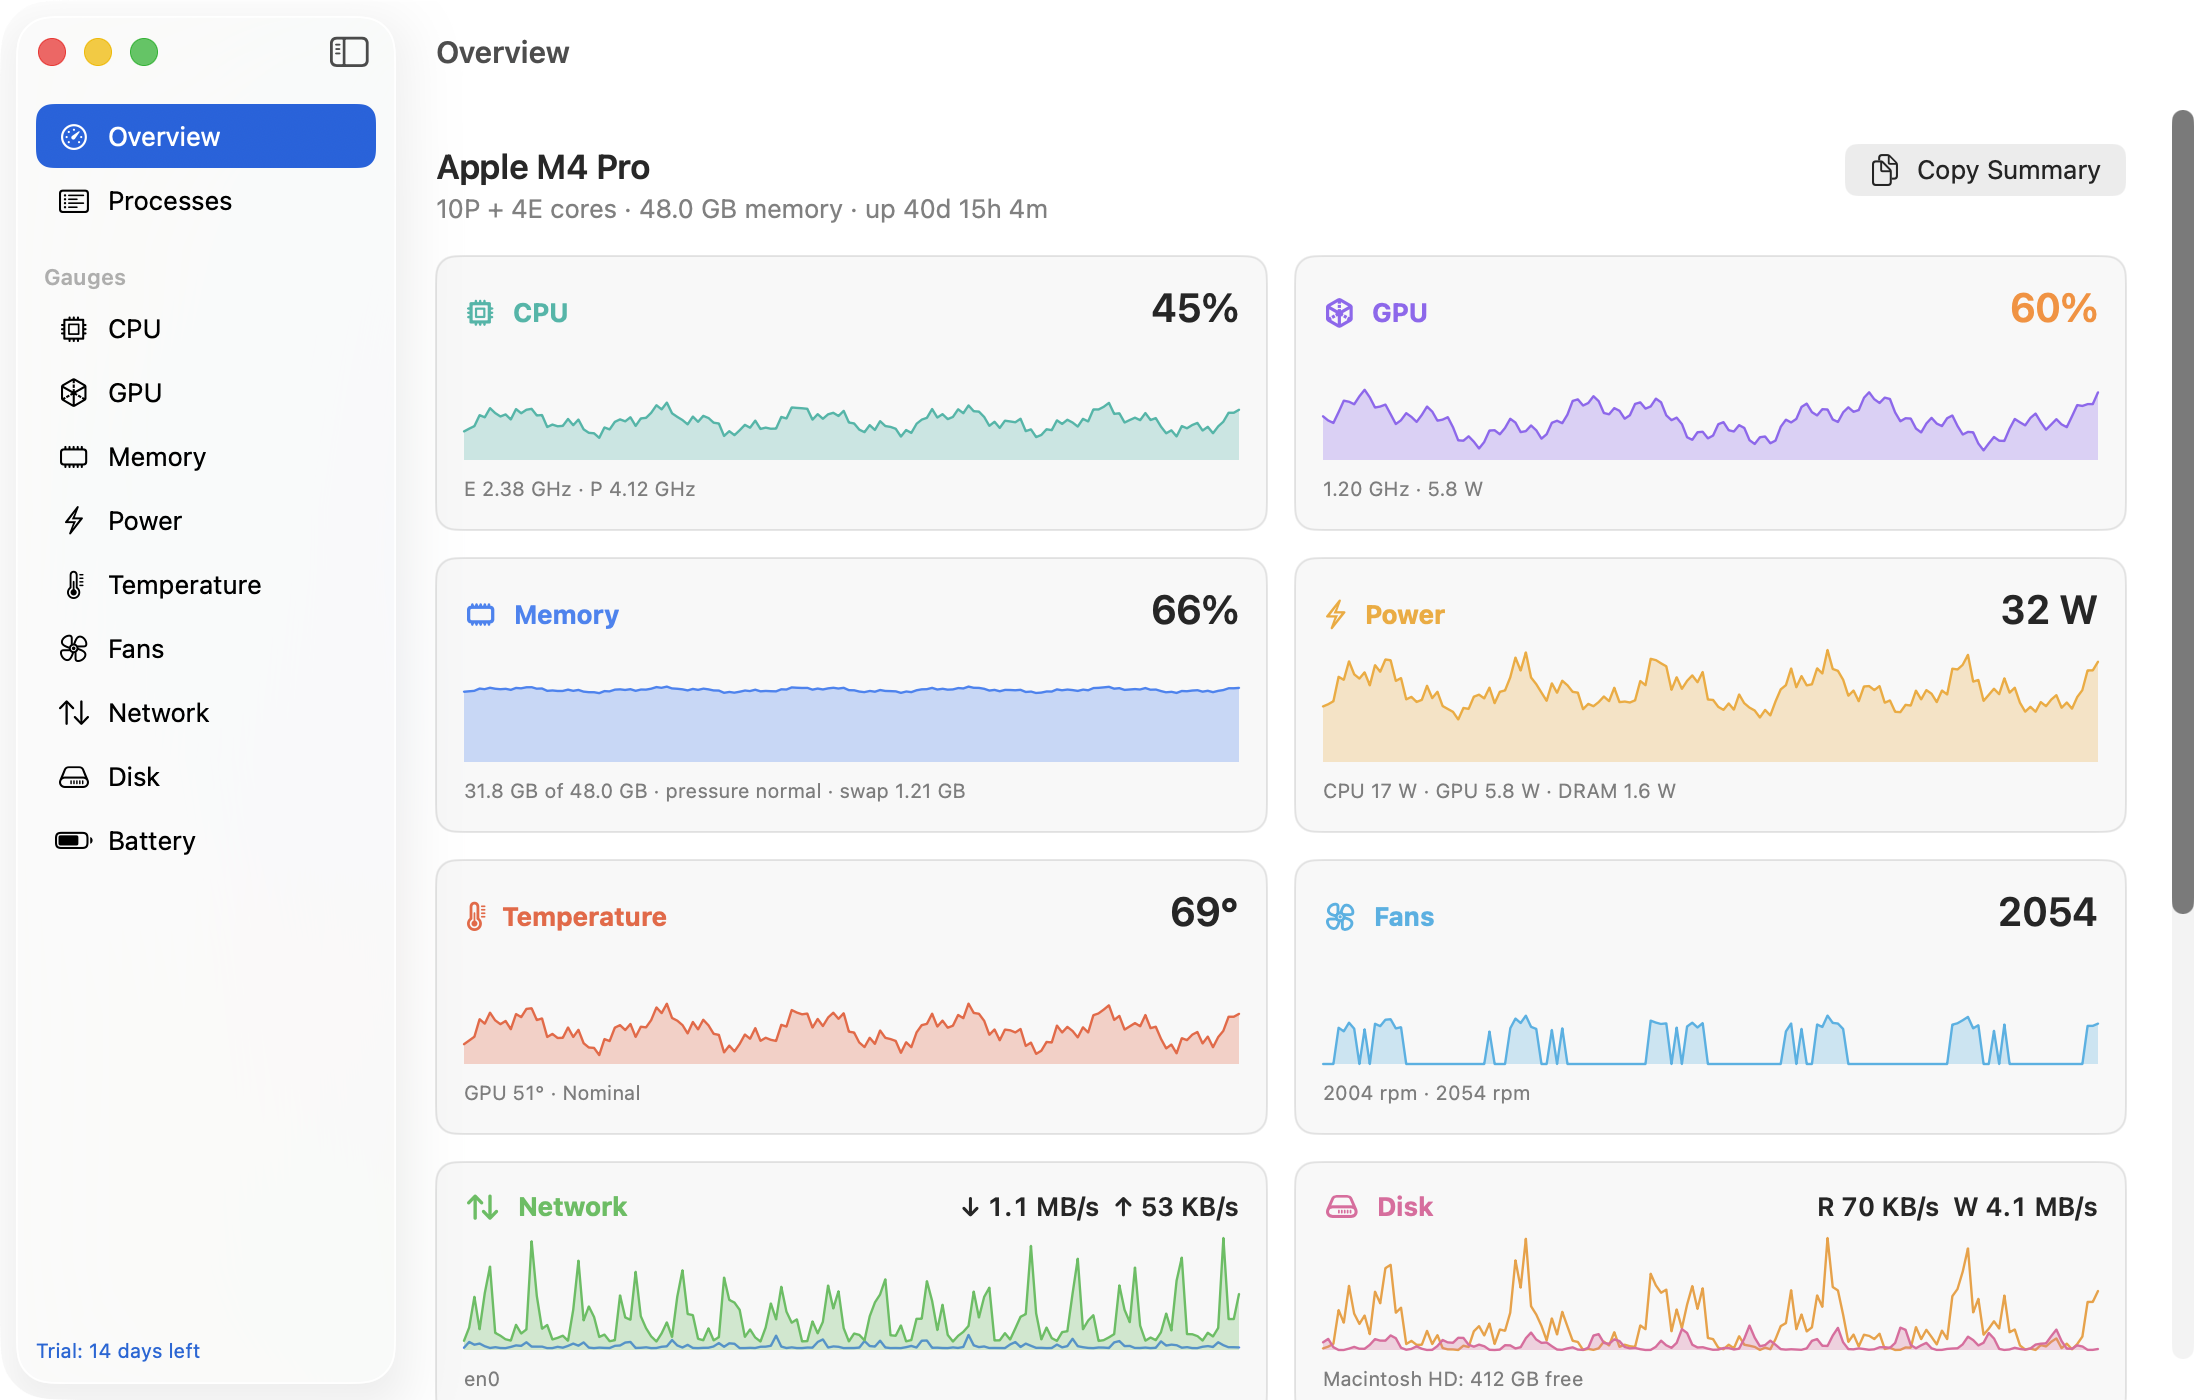
GaugeMon puts GPU usage in your menu bar without sudo, and on Apple Silicon its Power gauge breaks out the GPU rail in watts. Click a gauge for a 10-minute chart; the Overview window shows GPU next to CPU, memory and power.