 GaugeMon
Native macOS Menu Bar App
What is your Mac doing right now?
Activity Monitor, htop and mactop in one native Mac app, with a menu bar you arrange yourself. CPU, GPU, memory, power, temperature, fans, network, disk and battery at a glance, and a process list that lists every process and, with the optional helper, measures and manages root's too.
macOS 14 (Sonoma) or later • 14-day unrestricted trial • No account required
Three tools, one app
The menu bar you want, the detail when you need it.
Glance at the menu bar, click a gauge for the breakdown, open the window when you need to find and stop the process responsible.
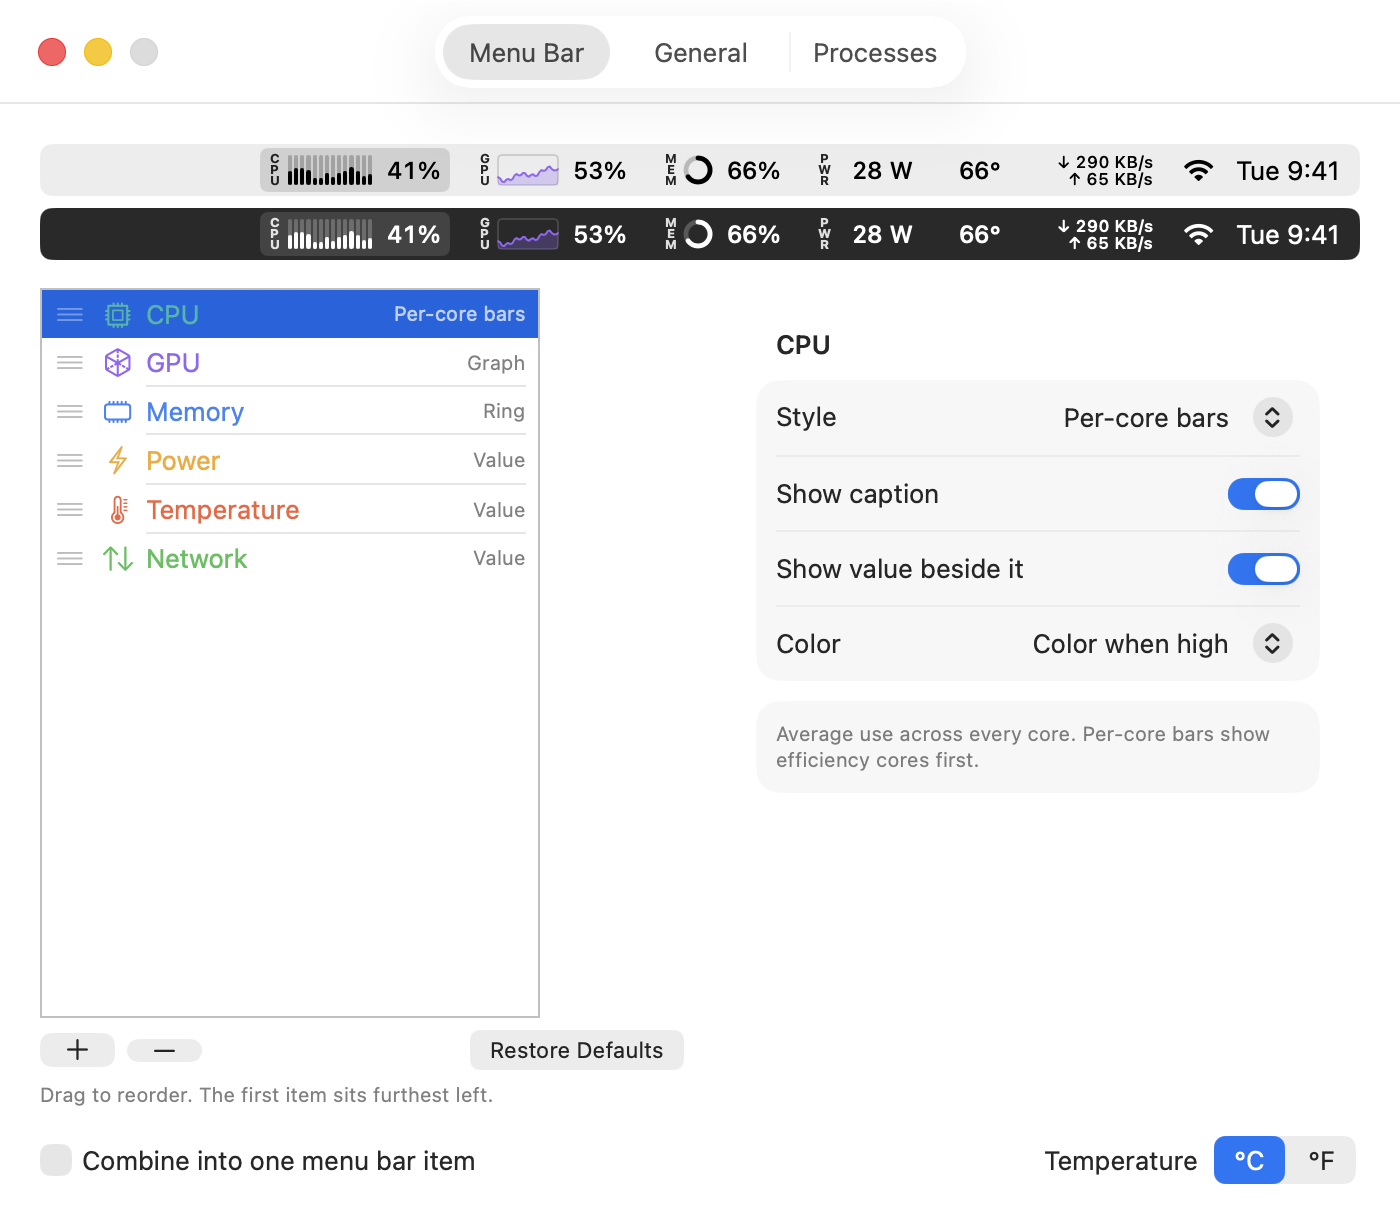
A menu bar you arrange yourself
Pick any mix of nine gauges: CPU, GPU, Memory, Power, Temperature, Fans, Network, Disk and Battery. Show them as separate menu bar items or combine them into one.
- Per gauge style: value, graph, bar, ring, or per-core bars for CPU.
- Optional captions ("CPU", "MEM") and colouring: monochrome, colour when high, or always coloured.
- Drag to reorder in Settings with a live preview. °C or °F.
- Gauges your Mac cannot show, like fans on a MacBook Air, are hidden rather than broken.
Click any gauge for the detail
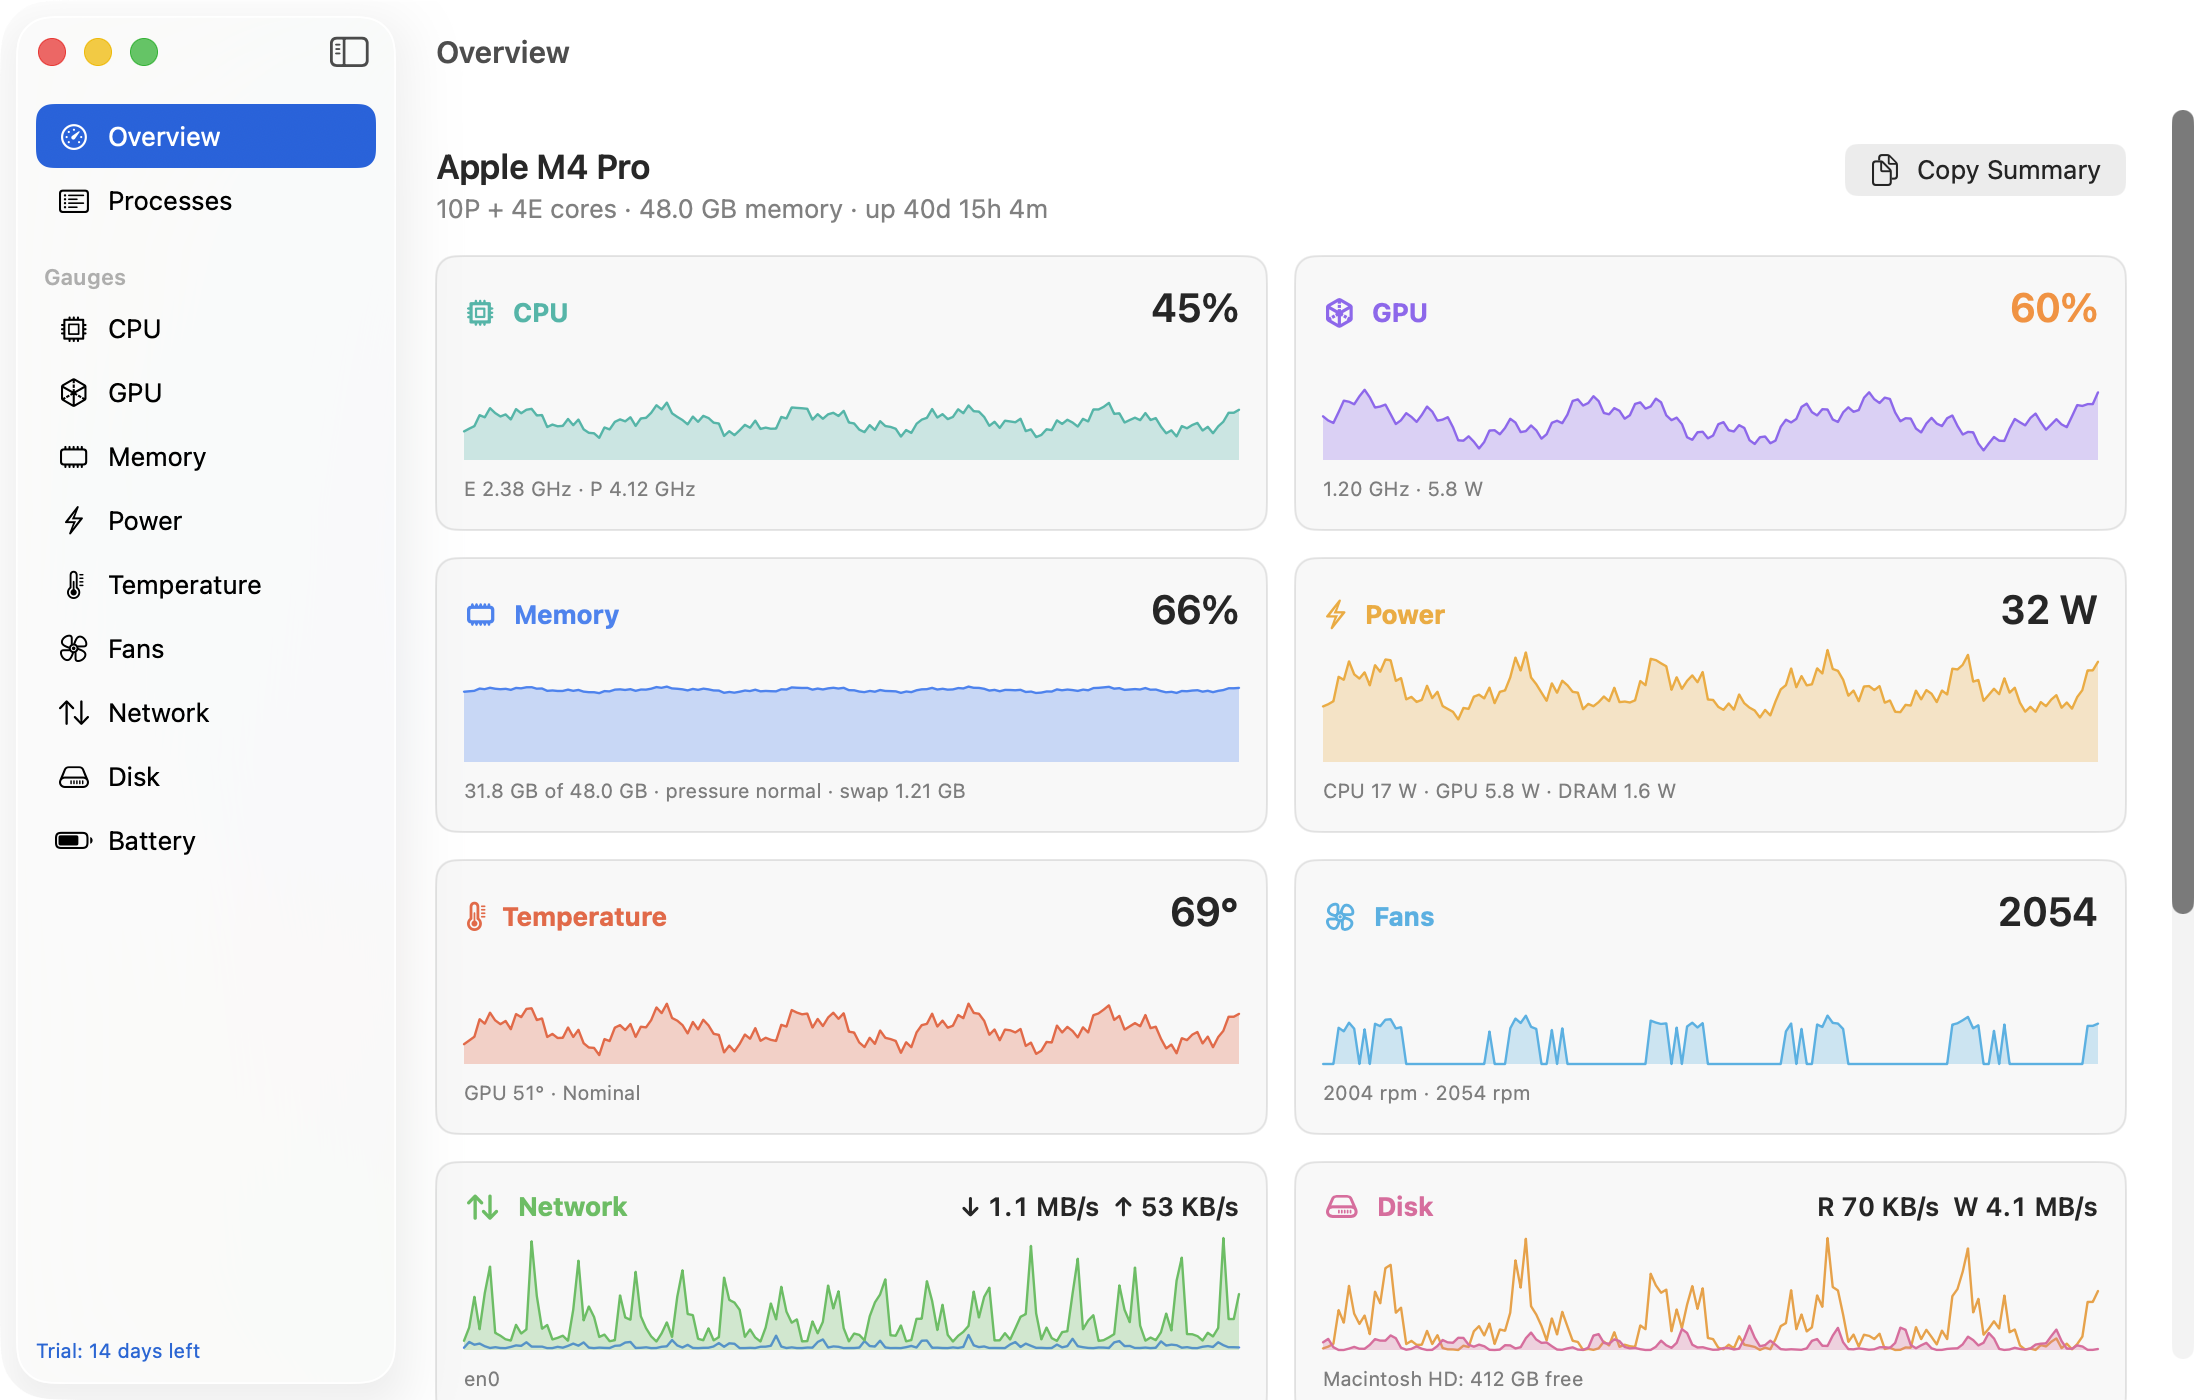
Every gauge opens a popover with the big number, a chart of the last 10 minutes, a breakdown and the top five processes for that gauge.
- CPU: E-cores vs P-cores and cluster frequencies.
- Memory: app, wired, compressed and cached, plus pressure and swap.
- Power: CPU, GPU, ANE and DRAM rails. Temperature: every sensor. Network: per interface.
- The Overview window shows every gauge as a card with its chart, mactop-style, with your chip and core layout.
An htop-style process list
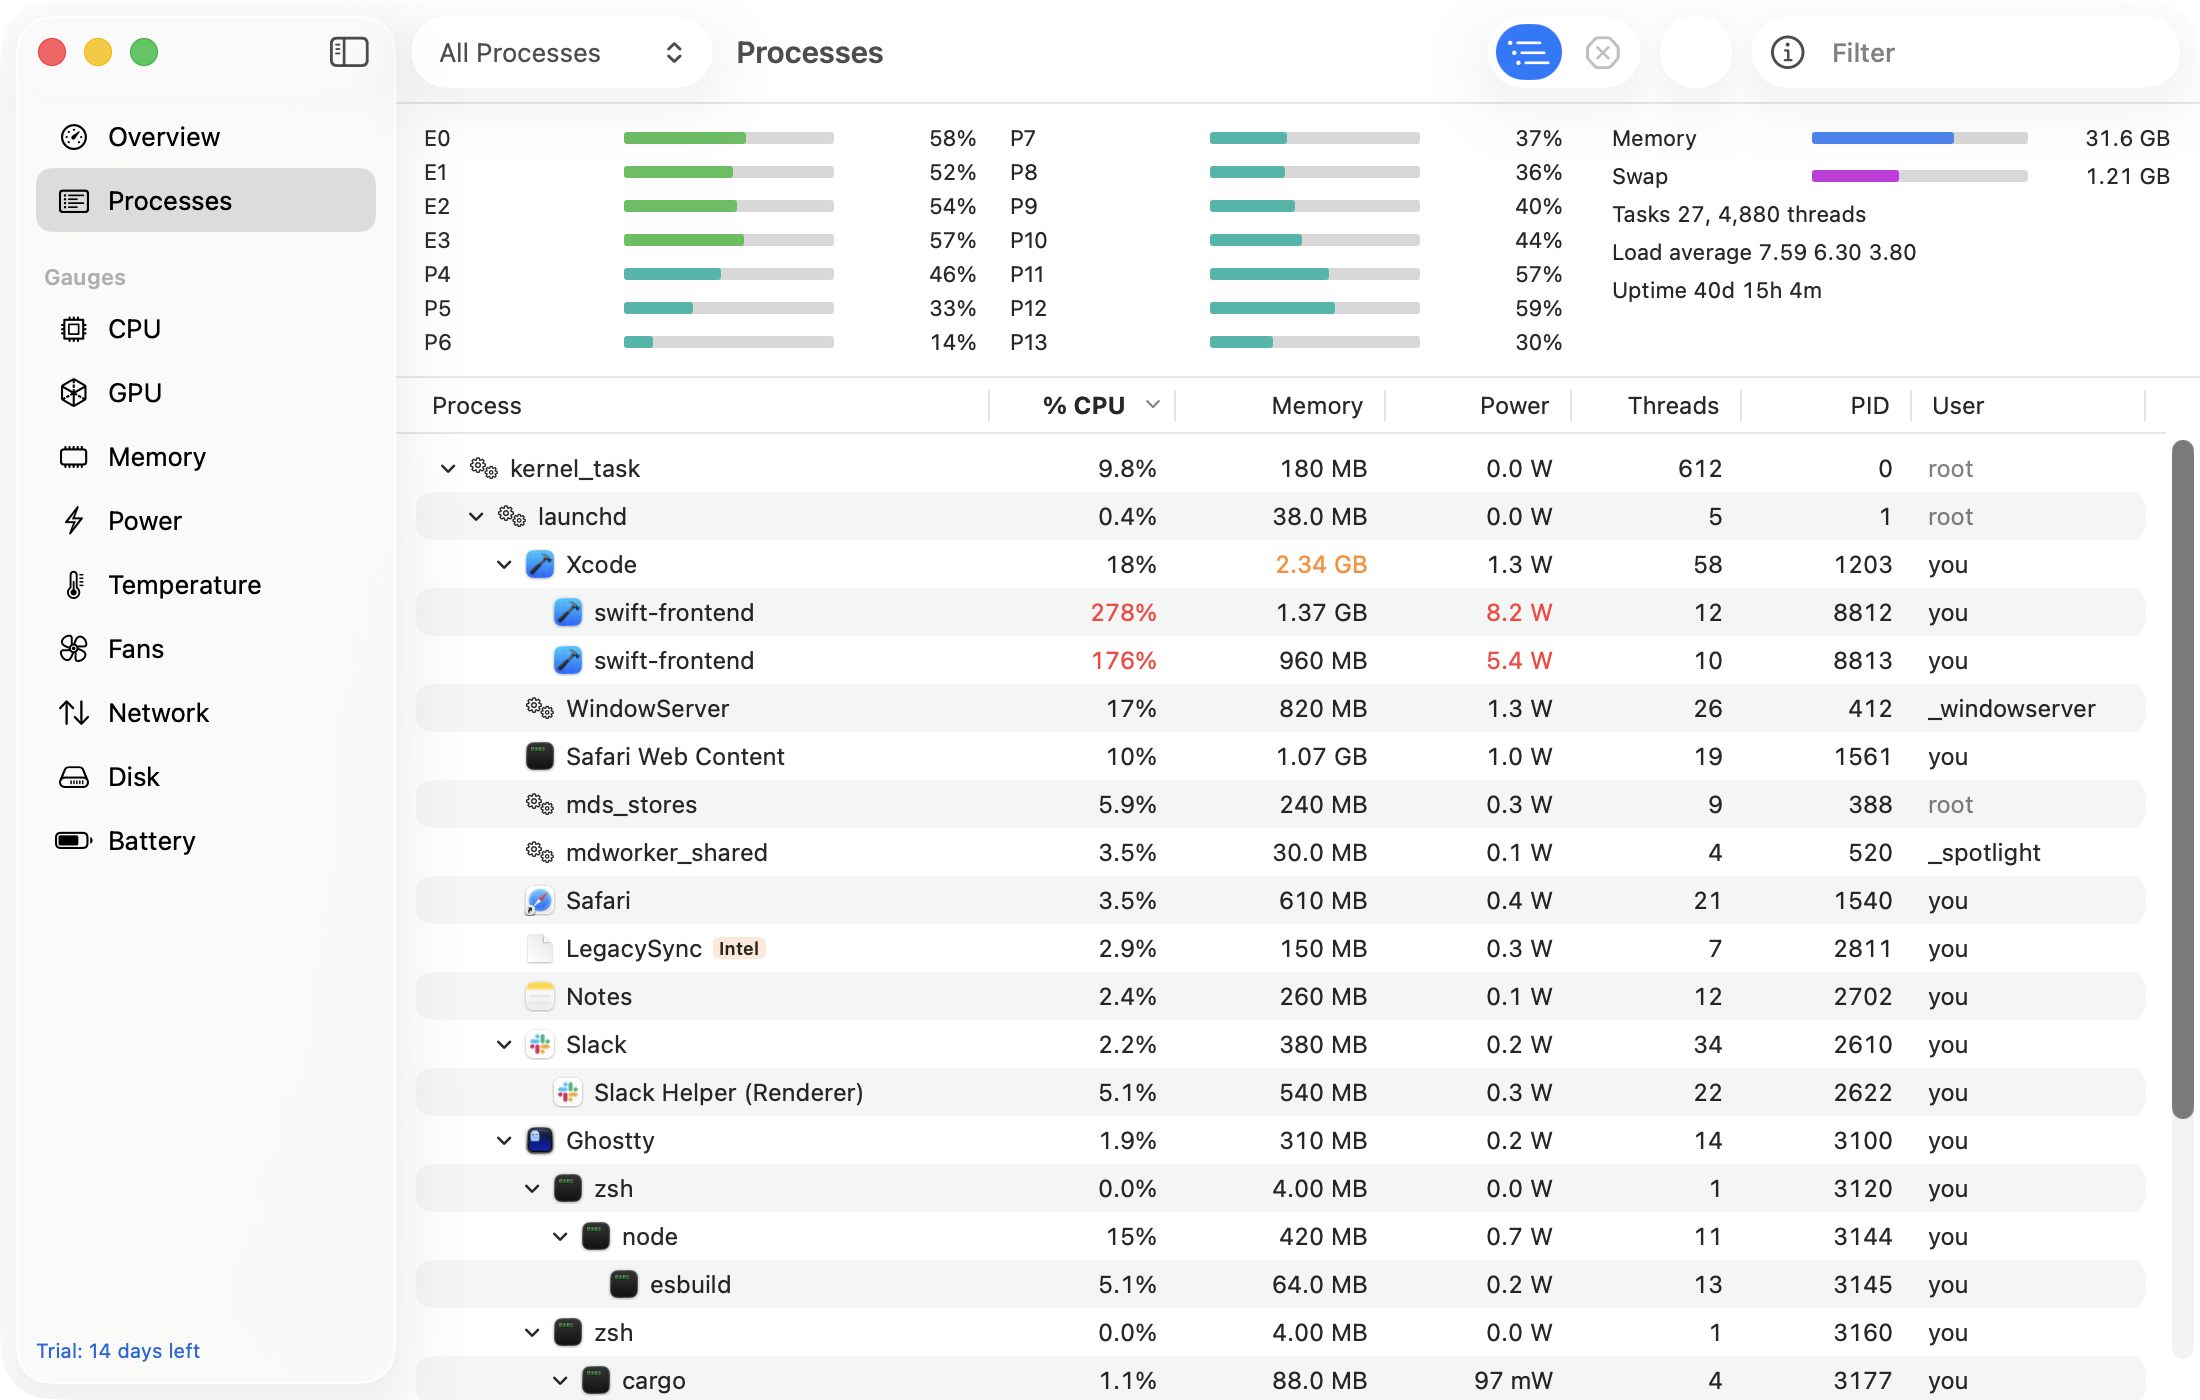
Per-core meters, load average and task and thread counts above a sortable table: CPU %, memory (physical footprint, as Activity Monitor), power in watts per process, threads, disk read and write per second, wakeups, CPU time, user and kind (Apple or Intel under Rosetta).
- Search filter (⌘F) and tree view of parents and children (⌘T).
- Inspector: path, arguments with secrets masked, working directory, parent chain, start time.
- Quit, Force Quit, Interrupt, Hang Up, Pause and Resume, with confirmation. GaugeMon checks it is still the same process before sending anything.
- Copy Summary puts a plain-text snapshot of the gauges and top processes on the clipboard, ready for Slack or a bug report.
How it works
No sudo. No subprocesses.
GaugeMon never runs top, ps or powermetrics. It reads the same kernel and IOKit sources they do, directly: power comes from the IOReport energy model that powermetrics needs sudo for, temperatures from the HID sensors, fans from a read-only SMC connection.
Why there is an optional helper. macOS only lets a process read CPU and memory for processes owned by the same user. That is why htop without sudo shows 0% for WindowServer and mds_stores. GaugeMon lists every process either way; to fill in the numbers for other users' processes, and to quit them, you can install a small privileged helper from Settings. It only reads process counters and sends one of six signals to a process that is still the one you picked. Uninstall it from Settings any time.
Light on your Mac. GaugeMon samples only what is on screen. With the window closed only the menu bar gauges are read, every 2 seconds by default (1, 2 or 5 s). Processes are only sampled while a process list is visible.
Simple, Transparent Pricing
Own it forever.
Includes 12 months of updates • Optional $9/year renewal to extend updates
Launch offer: 25% off with code LAUNCH25 until 30 September 2026.
- Use on up to 3 Macs
- Keeps working after the update window ends
- All nine gauges and the full process list
- 14-day fully unrestricted trial, no account
- Self-service activation reset portal
- 14-day no-questions-asked refund guarantee
After the trial every gauge and the process list keep working. Editing the menu bar layout and quitting or signalling processes need a license.
Frequently Asked Questions
Everything you need to know.
Does it work on Intel Macs?
Yes, on macOS 14 Sonoma or later. Power, CPU and GPU frequency, and temperature gauges need Apple Silicon (M1 or later). On Intel Macs GaugeMon shows CPU, GPU, memory, network, disk, fans and battery.
Do I need to install the helper?
No. Without it GaugeMon still shows every gauge and lists every process; the CPU and memory columns are filled in for your own processes. The helper adds the numbers for processes owned by root and other users, and lets you quit them. See Help for exactly what it does.
Why is it not in the Mac App Store?
The App Store sandbox forbids the privileged helper and reading the SMC and IOReport, which is where the power, fan and frequency numbers come from.
Does GaugeMon send anything anywhere?
Only license validation and update checks. No telemetry and no accounts. See the privacy policy.
What happens after the trial?
Every gauge and the process list keep working. Editing the menu bar layout and quitting or signalling processes need a license.